Crypto Futures Premium Dashboard
A Shiny dashboard that pulls crypto futures premium from okex’s APIs
Background
I’m an avid crypto-enthuaist. With the recent price movements, I’ve been trying to follow the futures premium movements but there was no open source easy way to look at premiums, so I decided to build my own dashboard to pull real-time data.
- Tech Stack Used: Python (Data Pipeline), R, Shiny, Nginx
- Demo: http://shiny2.alfredlin.com/posts/cyp/crypto_premium_shiny/
- Github: https://github.com/alflin/crypto_premium_python

The App:
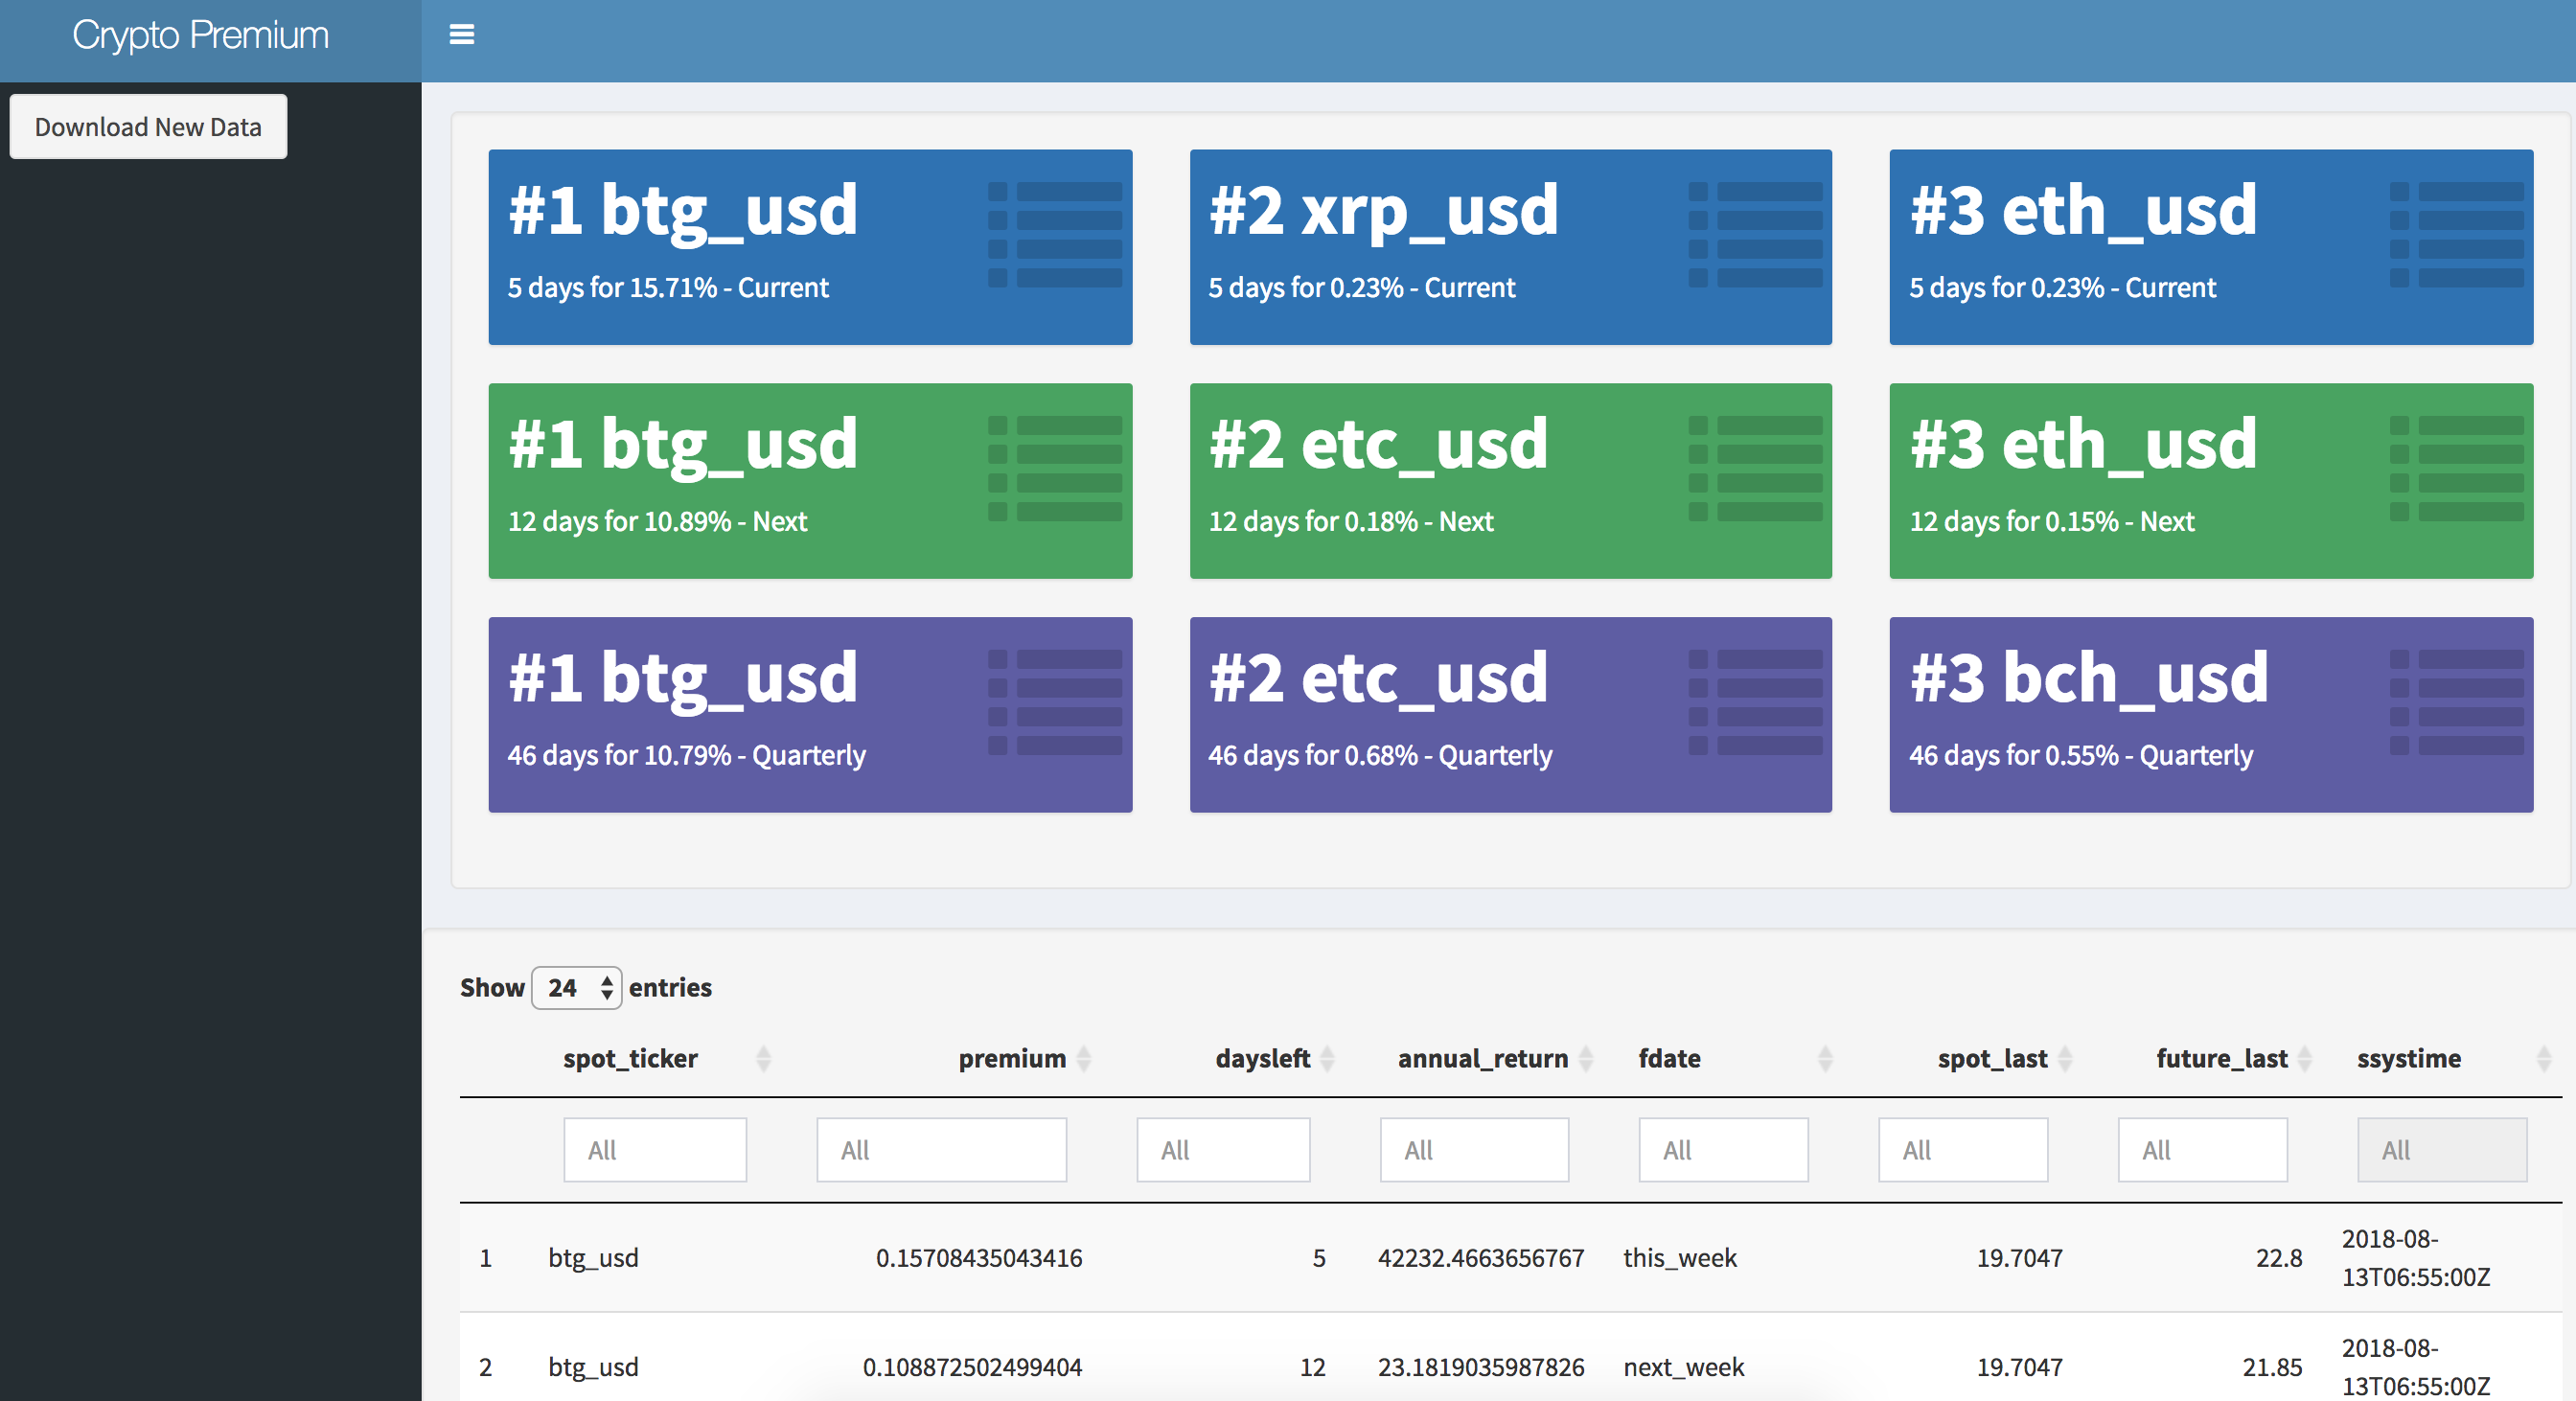
Pretty self-explanatory. There’s a button on the sidebar menu that downloads the most recent futures data from OKEX exchange. Afterwards the premiums for all crypto-premiums are calculated and displayed. The top 9 squares show the top 3 trading pairs from the three different duration contracts available on okex’s platform.
The table below is a combination of the raw data plus some computing metrics of all the futures data available.
I wont be going into the details of how the math works for futures premium as I assume the reader will understand how the calculations are made. Instead, I’ll focus on the process of what I did to get the data below.

Data Pipeline
Python Pull
The getting the data pipline to work was what took the most time for me in this project.
Luckily to pull trading data, I only needed to use the REST APIs (no websocket funky business). Looking through the okex documentation was pretty straight forward, but making sure I had the right data format pulled out properly and parsing is what took the longest.
Here’s an example of my cleaning function to pull the data properly:
def fclean(import_data):
	#takes data and cleans and exports data as pandas
	export_data = []
	for x in range(0,len(import_data)):
		entry = {
			'futures_ticker': import_data[x]['futures_ticker'],
			'fdate': import_data[x]['fdate'],
			'fdatetime': timeit(import_data[x]['response']['date']),
			'fsystime': timeit(time.time()),
			'future_last': import_data[x]['response']['ticker']['last']
			}
		export_data.append(entry)

	return pd.DataFrame(export_data)
As usual, I used the pandas library to do all my data manipulation and data munging at the end to calculate the premiums.
df = sdf.merge(fdf, how='inner', left_on = 'spot_ticker',right_on = 'futures_ticker')
df[['spot_last','future_last']] = df[['spot_last','future_last']].apply(pd.to_numeric)
df['premium'] = (df['future_last'] - df['spot_last']) / df['spot_last']
OKex API documentation comes in English and Chinese!

Front End
Putting it all together
I just simply used the shinydashboard package to display all the metrics is a not so ugly format. Nothing too special here, just a datatable render for the raw data and some valueboxes at the top to highlight the highest premium trading pairs.
The only thing I’d highlight is calling the python script to hit hte okex API with the download button. Since I originally started building the script in python I didn’t want to redo it all in R, so I used the python package reticulate to use the script.
I came into some trouble since it was my first time using the package, but quickly I learned I had to initate a virtual environment within the shiny environment first before I could use the python script properly.
Here’s an excerpt of the code:
observeEvent(input$download, {
    withProgress(message = 'Downloading new Data', value = 0, {
      use_virtualenv('./venv', required = TRUE)
      okex <- import_from_path('okex', path = ".", convert = TRUE)
      okex$csv_update_current()
      output$msg <- renderText({"finished downloading"})
      invalidater$v <- invalidater$v + 1
    })
